获取Canvas中各种路径上的点
在 canvas 中制作粒子动画时,时常需要获取各种曲线路径组成的坐标点,从而实现动画效果;因此就花了点时间去研究一些常用曲线路径坐标点的获取方式,顺便制作成了一个插件:unit-path
插件共完成了直线、二阶贝塞尔曲线、三阶贝塞尔曲线以及圆/圆弧上的坐标点的获取方式。下面说说如何去获取这些坐标点。
直线
直线,也称为一阶贝塞尔曲线,由两个点相连组成。在 canvas 中可以通过以下方式来绘制:
js
const startPoint = getPoint(50, 50);
const endPoint = getPoint(200, 50);
ctx.strokeStyle = 'red';
ctx.beginPath();
ctx.moveTo(startPoint.x, startPoint.y);
ctx.lineTo(endPoint.x, endPoint.y);
ctx.closePath();
ctx.stroke();
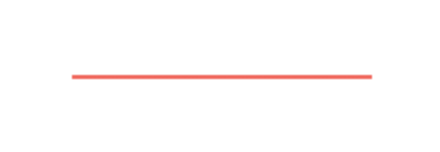
这些我们就可以得到一条由起点(50,50)开始到终点(50, 200)形成的一条红色的直线。
根据直线坐标计算公式:B(t) = P0 + (P1 - P0) * t, t ∈ [0,1],我们可以计算出该直接上任意点的坐标:
js
function getPathPoint (p0, p1) {
const { x: x0, y: y0 } = p0;
const { x: x1, y: y1 } = p1;
return function (t) {
if (t < 0 || t > 1) {
throw new RangeError('The value range of parameter "t" is [0,1]');
}
return {
x: x0 + (x1 - x0) * t,
y: y0 + (y1 - y0) * t
};
}
}
const linePath = getPathPoint(startPoint, endPoint);
const point = linePath(.1);
console.log(point); // {x: 65, y: 50}
然后我们可以通过该方法来获取直线上多个平均分布的点:
js
let quantity = 20;
let t;
let p;
for (let i = 0; i < quantity; i++) {
ctx.save();
ctx.fillStyle = 'blue';
ctx.globalAlpha = '.5';
t = i / (quantity - 1);
p = linePath(t);
ctx.fillRect(p.x - 2, p.y - 2, 4, 4);
ctx.restore();
}
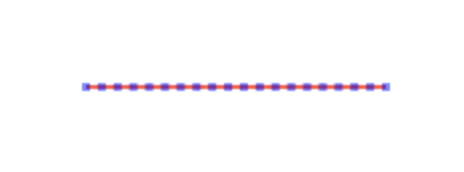
上图中,浅蓝色的小方块就是我们获取到的20个平均分布在直线上的点。
二阶贝塞尔曲线
二阶贝塞尔曲线有三个主要的点:起始点、控制点和终点,曲线经过起始点和终点。在 canvas 中可以通过 ctx.quadraticCurveTo(cp.x, cp.y, e.x, e.y)来绘制:
js
const startPoint = getPoint(50, 50);
const controlPoint = getPoint(150, 150);
const endPoint = getPoint(250, 50);
ctx.strokeStyle = 'red';
ctx.beginPath();
ctx.moveTo(startPoint.x, startPoint.y);
ctx.quadraticCurveTo(controlPoint.x, controlPoint.y, endPoint.x, endPoint.y);
ctx.stroke();
ctx.closePath();
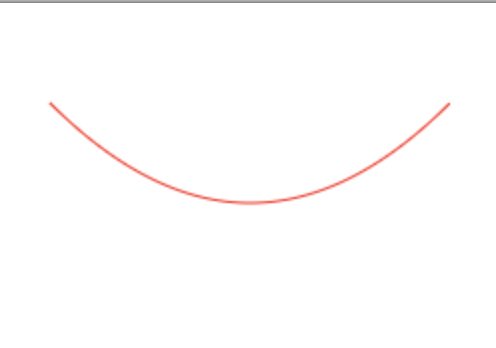
得到的曲线如下图所示:
根据二阶贝塞尔曲线计算公式:B(t) = (1 - t)² * P0 + 2 * t * (1 - t) * P1 + t² * P2, t ∈ [0,1] ,我们可以计算出曲线上任意的点:
js
function getPathPoint (sp, cp, ep) {
const { x: x0, y: y0 } = sp;
const { x: x1, y: y1 } = cp;
const { x: x2, y: y2 } = ep;
return function (t) {
if (t < 0 || t > 1) {
throw new RangeError('The value of parameter "t" is [0,1]');
}
return {
x: Math.pow(1 - t, 2) * x0 + 2 * t * (1 - t) * x1 + Math.pow(t, 2) * x2,
y: Math.pow(1 - t, 2) * y0 + 2 * t * (1 - t) * y1 + Math.pow(t, 2) * y2
};
}
}
const curvePath = getPathPoint(startPoint, controlPoint, endPoint);
const point = curvePath(.5);
console.log(point); // {x: 150, y: 100}
我们可以通过该方法来获取曲线上任意的点:
js
let quantity = 20;
let t;
let p;
for (let i = 0; i < quantity; i++) {
ctx.save();
ctx.fillStyle = 'blue';
ctx.globalAlpha = '.5';
t = i / (quantity - 1);
p = curvePath(t);
ctx.fillRect(p.x - 2, p.y - 2, 4, 4);
ctx.restore();
}
如下图所示:

三阶贝塞尔曲线
三阶贝塞尔曲线,也就是真正的贝塞尔曲线,它由4个点形成:起始点、控制点1、控制点2和终点。曲线从起始点到终点,一般不会经过两个控制点。在 canvas 中可以通过ctx.bezierCurveTo(cp1.x, cp1.y, cp2.x, cp2.y, e.x, e.y)来绘制:
js
const sp = getPoint(50, 50);
const cp1 = getPoint(200, 50);
const cp2 = getPoint(50, 400);
const ep = getPoint(350, 300);
ctx.strokeStyle = 'red';
ctx.beginPath();
ctx.moveTo(sp.x, sp.y);
ctx.bezierCurveTo(cp1.x, cp1.y, cp2.x, cp2.y, ep.x, ep.y);
ctx.stroke();
ctx.closePath();
得到的曲线如下图所示:
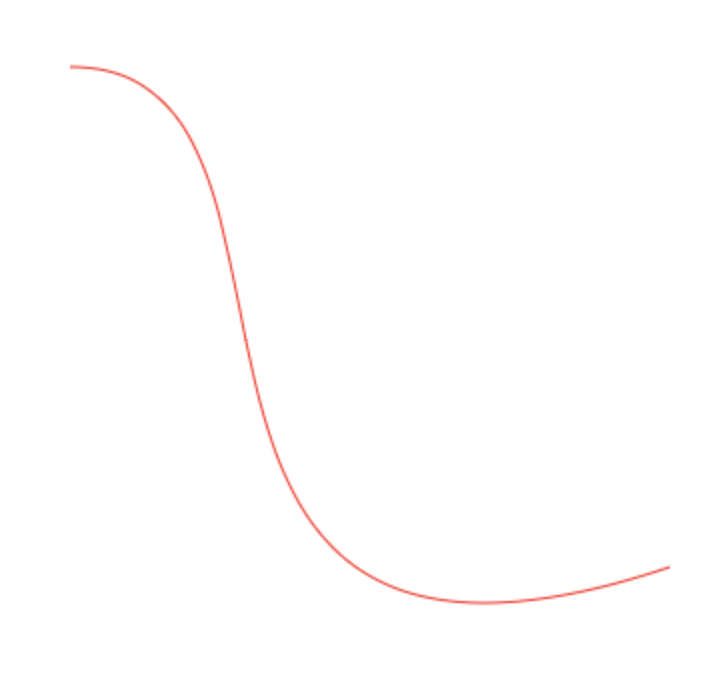
根据三阶贝塞尔曲线计算公式:B(t) = P0 * (1 - t)³ + 3 * P1 * t * (1 - t)² + 3 * P2 * t² * (1 - t) + P3 * t³, t ∈ [0,1],我们可以获取该曲线上的任意点:
js
function getPathPoint (sp, cp1, cp2, ep) {
const { x: x0, y: y0 } = sp;
const { x: x1, y: y1 } = cp1;
const { x: x2, y: y2 } = cp2;
const { x: x3, y: y3 } = ep;
return function (t) {
if (t > 1 || t < 0) {
throw new Error('The value range of paramter "t" is [0, 1].');
}
return {
x: x0 * Math.pow(1 - t, 3) + 3 * x1 * t * Math.pow(1 - t, 2) + 3 * x2 * Math.pow(t, 2) * (1 - t) + x3 * Math.pow(t, 3),
y: y0 * Math.pow(1 - t, 3) + 3 * y1 * t * Math.pow(1 - t, 2) + 3 * y2 * Math.pow(t, 2) * (1 - t) + y3 * Math.pow(t, 3)
};
};
}
const bezierPath = getPathPoint(sp, cp1, cp2, ep);
const point = bezierPath(.5);
console.log(point); // {x: 143.75, y: 212.5}
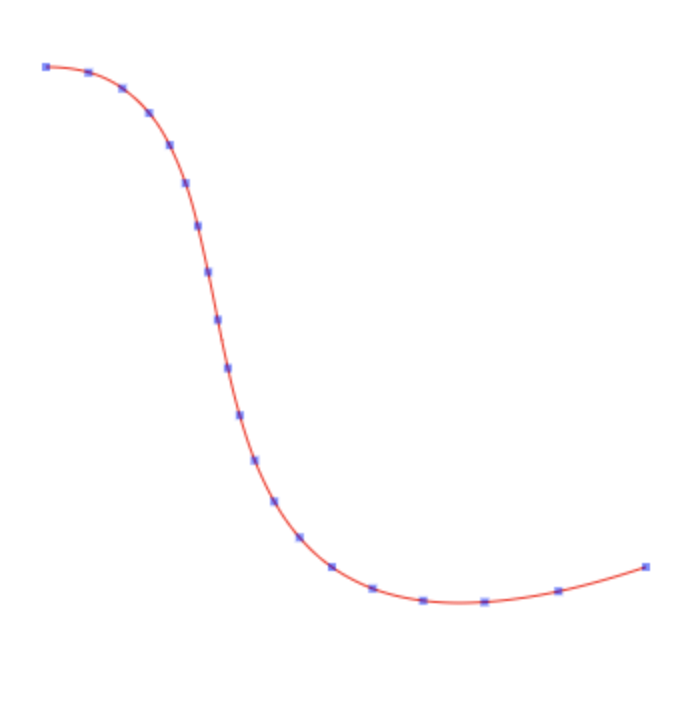
通过上述的方法,我们可以很轻易地获取曲线上的组成点:
js
let quantity = 20;
let t;
let p;
for (let i = 0; i < quantity; i++) {
ctx.save();
ctx.fillStyle = 'blue';
ctx.globalAlpha = '.5';
t = i / (quantity - 1);
p = bezierPath(t);
ctx.fillRect(p.x - 2, p.y - 2, 4, 4);
ctx.restore();
}
如图所示:
圆 / 圆弧
在 canvas 中,我们可以通过ctx.arc(x, y, r, sAngle, eAngle, anitclockwise = false)来绘制圆或圆弧。
js
ctx.beginPath();
ctx.strokeStyle = 'red';
ctx.arc(200, 200, 100, 0, 2 * Math.PI);
ctx.stroke();
ctx.closePath();
ctx.beginPath();
ctx.strokeStyle = 'yellowgreen';
ctx.arc(400, 200, 100, 1.5 * Math.PI, 0, true);
ctx.stroke();
ctx.closePath();
通过上面的代码,我们可以得到一个圆和一个圆弧:
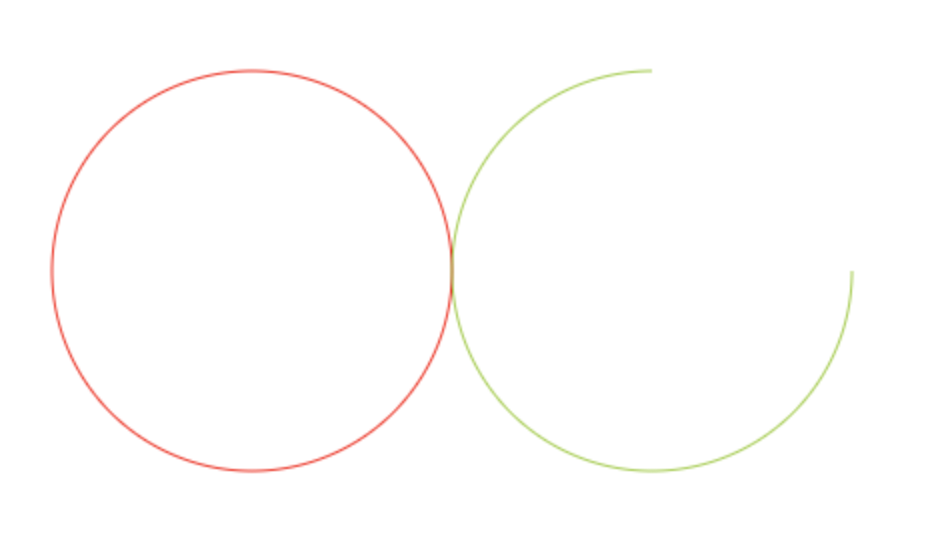
根据圆周上的点计算公式:
js
// 其中(cx,cy)为圆心坐标,degree为弧度值,r为半径
x = cx + Math.cos(degree) * r
y = cy = Math.sin(degree) * r
我们可以通过上面的公式来获取圆周上任意的点:
js
function getPathPoint (x, y, r, sAngle, eAngle, anitclockwise = false) {
const PI = Math.PI;
const PI2 = 2 * PI;
if (anitclockwise) {
// 顺时针绘制时,交换起始角和结束角
([sAngle, eAngle] = [eAngle, sAngle]);
}
// 根据canvas的绘制特点,处理特殊情况
if (eAngle - sAngle >= PI2) {
eAngle = sAngle + PI2;
} else {
if (sAngle !== eAngle) {
if ((sAngle - eAngle) % PI2 === 0) {
eAngle = sAngle;
} else {
sAngle = sAngle % PI2;
while (eAngle > sAngle + PI2) {
eAngle -= PI2;
}
}
}
}
// 获取圆/圆弧的总弧度
const angleCount = sAngle > eAngle
? PI2 - sAngle + eAngle
: eAngle - sAngle;
return function (t) {
if (t > 1 || t < 0) {
throw new Error('The value range of paramter "t" is [0, 1].');
}
if (anitclockwise) {
// 反方向
t = 1 - t;
}
const degree = angleCount * t + sAngle;
return {
x: x + Math.cos(degree) * r,
y: y + Math.sin(degree) * r
};
}
}
const arcPath1 = getPathPoint(200, 200, 100, 0, 2 * Math.PI);
const arcPath2 = getPathPoint(400, 200, 100, 1.5 * Math.PI, 0, true);
console.log(arcPath1(.5)); // {x: 100, y: 200}
console.log(arcPath2(.5)); // {x: 329.28932188134524, y: 270.71067811865476}
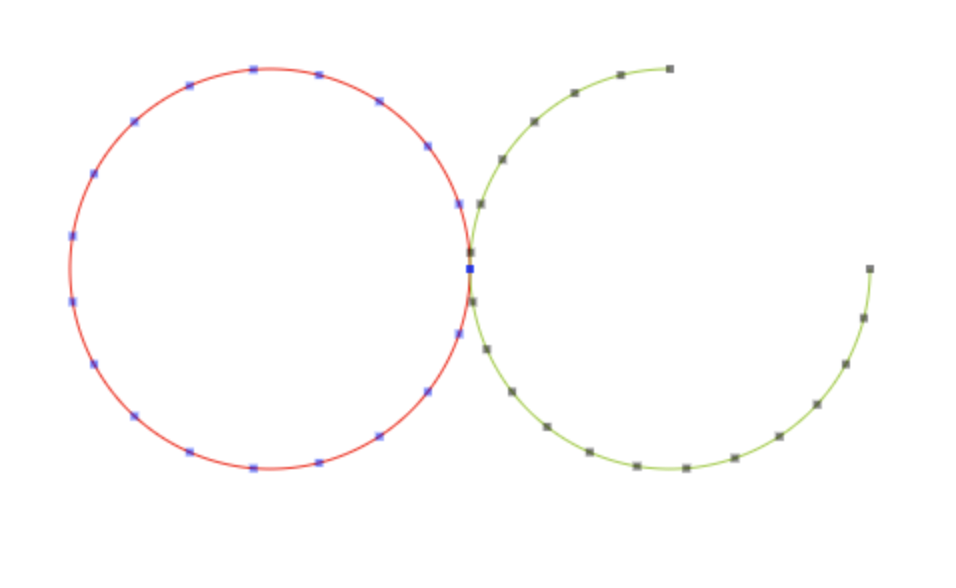
通过上面的方法,我们可以很轻易地获取圆/圆弧上的组成点:
js
let quantity = 20;
let t;
let p1;
let p2;
for (let i = 0; i < quantity; i++) {
ctx.save();
ctx.globalAlpha = '.5';
ctx.fillStyle = 'blue';
t = i / (quantity - 1);
p1 = arcPath1(t);
p2 = arcPath2(t);
ctx.fillRect(p1.x - 2, p1.y - 2, 4, 4);
ctx.fillStyle = 'black';
ctx.fillRect(p2.x - 2, p2.y - 2, 4, 4);
ctx.restore();
}
如下图所示:
粒子动画
js
const sp = getPoint(50, 50);
const cp1 = getPoint(200, 50);
const cp2 = getPoint(50, 400);
const ep = getPoint(350, 300);
function drawPath () {
ctx.save();
ctx.strokeStyle = '#000';
ctx.globalAlpha = '.1';
ctx.beginPath();
ctx.moveTo(sp.x, sp.y);
ctx.bezierCurveTo(cp1.x, cp1.y, cp2.x, cp2.y, ep.x, ep.y);
ctx.stroke();
ctx.closePath();
ctx.restore();
}
function getPathPoint (sp, cp1, cp2, ep) {
const { x: x0, y: y0 } = sp;
const { x: x1, y: y1 } = cp1;
const { x: x2, y: y2 } = cp2;
const { x: x3, y: y3 } = ep;
return function (t) {
if (t > 1 || t < 0) {
throw new Error('The value range of paramter "t" is [0, 1].');
}
return {
x: x0 * Math.pow(1 - t, 3) + 3 * x1 * t * Math.pow(1 - t, 2) + 3 * x2 * Math.pow(t, 2) * (1 - t) + x3 * Math.pow(t, 3),
y: y0 * Math.pow(1 - t, 3) + 3 * y1 * t * Math.pow(1 - t, 2) + 3 * y2 * Math.pow(t, 2) * (1 - t) + y3 * Math.pow(t, 3)
};
};
}
const bezierPath = getPathPoint(sp, cp1, cp2, ep);
const point = bezierPath(.5);
function getPoints (quantity = 200) {
const points = [];
let t;
let p;
for (let i = 0; i < quantity; i++) {
t = i / (quantity - 1);
p = bezierPath(t);
points.push(p);
}
return points;
}
const allPoints = getPoints(200);
const length = allPoints.length;
const MAX = 52;
const temp = [];
let i = 0;
let timer;
function loop () {
if (i >= length) {
i = 0;
}
temp.push(allPoints[i++]);
if (temp.length > MAX) {
temp.shift();
}
ctx.clearRect(0, 0, 600, 500);
drawPath();
temp.forEach((point, index) => {
ctx.save();
ctx.fillStyle = `hsl(${300 - 2 * (i + 1)}, 100%, 50%)`;
ctx.globalAlpha = index * 0.02;
ctx.beginPath();
ctx.arc(point.x, point.y, index * 0.1, 0, 2 * Math.PI);
ctx.closePath();
ctx.fill();
ctx.restore();
});
timer = requestAnimationFrame(loop);
}
loop();
效果如下图